CRIM 250 Final Project
Elizabeth Stoner, Natalie Yang, Sophia Restaino, Johanna Doherty, Carmen Avery
10/04/2021
output: html_document
Introduction
For our final project, we looked at how different demographic factors are associated with prison release. We used a dataset from Open Data Philly, which includes information about the people released back into society coming out of both the Philadelphia Department of Prisons and the Pennsylvania Department of Corrections. This data shows a snapshot of release history, with data from 2015. Overall, it looks at the people who were charged with a criminal non-summary type offense[1].
The data contains information on 24,089 released individuals. The six columns of data include the custody agency from which each person was released, the date of their release, and some demographic information regarding sex, age, and race or ethnicity. In addition, it includes zip code data for each person. There are no nulls in the data except for zip code, but this is not a variable of interest. Although we will look at each of these demographic factors alongside race in our data analysis, our main research question for the project is: Does race have an effect on which inmates are released back into Philadelphia from State or Philadelphia prisons?
For some motivation and context into the chosen research question, it is important to understand the difference between the city and state prison systems. The PA State Prison System releases inmates back into Philadelphia from just prisons, whereas the Philadelphia Department of Prisons includes jails. This is relevant because where prisons house inmates already convicted of more serious crimes, jails house both people convicted of minor crimes as well as those awaiting trial who have not yet been convicted. We decided that this distinction would make it interesting to see how race may be associated with whether an individual is released back to Philly from the PDP vs. the PA State system.
Exploratory Data Analysis
The following exploratory data analysis will examine the main variable of interest, race, as well as each of the other demographic factors with number of releases in order to get a preliminary understanding of the relationship between the variables.
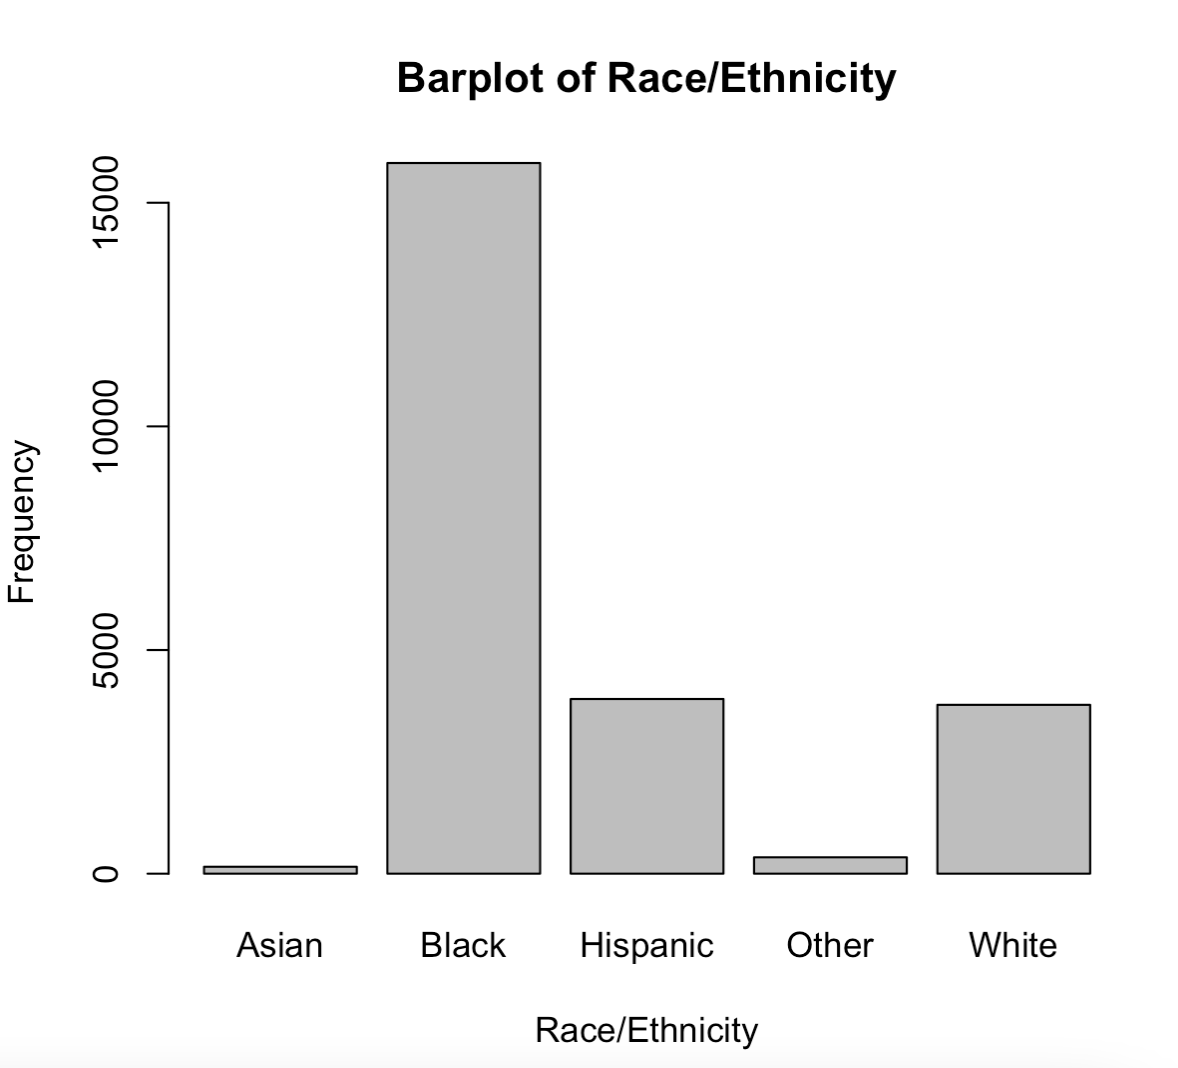
Race and Releases:
This barplot shows the distribution of race/ethnicity of people released. The highest number are Black followed by white and Hispanic. This is likely due in part to the disparities in incarceration rates of people of color as compared to whites, but the large differences between these frequencies calls for further exploration of this variable as it relates to releases. This could also be due to the racial demographics of Philadelphia.
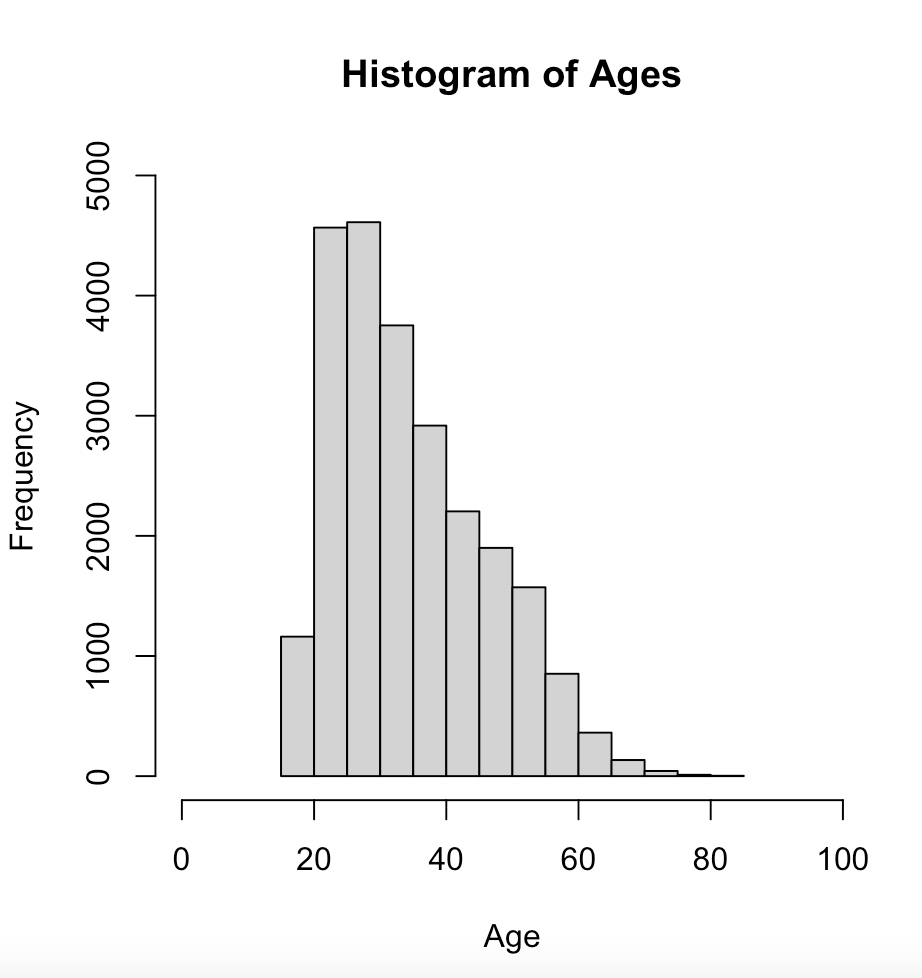
Age and Releases:
In the below histogram we see that the data distribution is skewed to the right, with the most common age range of those released being between the ages of 20 and 40. This is likely due to the fact that this is also the most common age for crime and offending in general, and there is likely a higher proportion of inmates between 20 and 40 overall.
Sex and Releases:
In the below histogram we see that there were far more male inmates released than female. This is likely due to the fact that there are higher populations of male inmates in Philadelphia prisons (and prisons in general) overall, so there are more of them to be released. 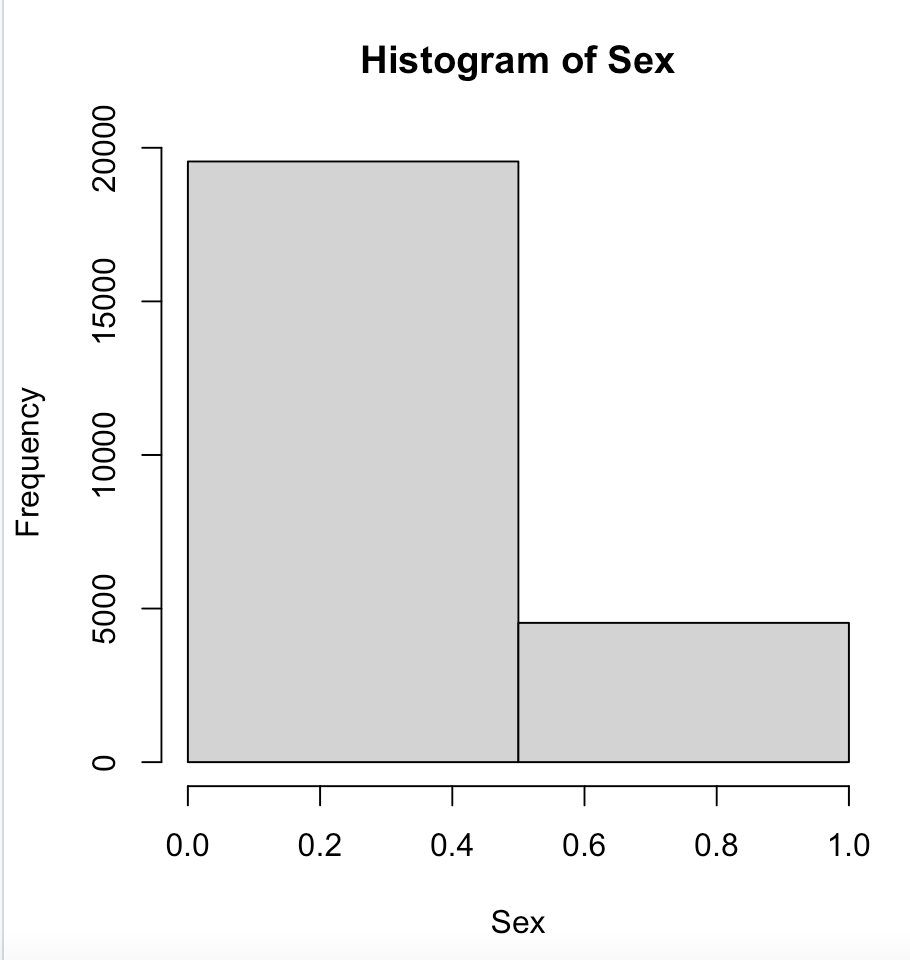

Custody Agency and Releases:
In the below histogram, demonstrating the frequency of release by Custody Agency (0 - 0.5 representing the Phila Dept of Prisons and 0.5 - 1 representing the State Prison System), we can see that the Philadelphia Department of Prisons released many more inmates in 2015 than did the state system. 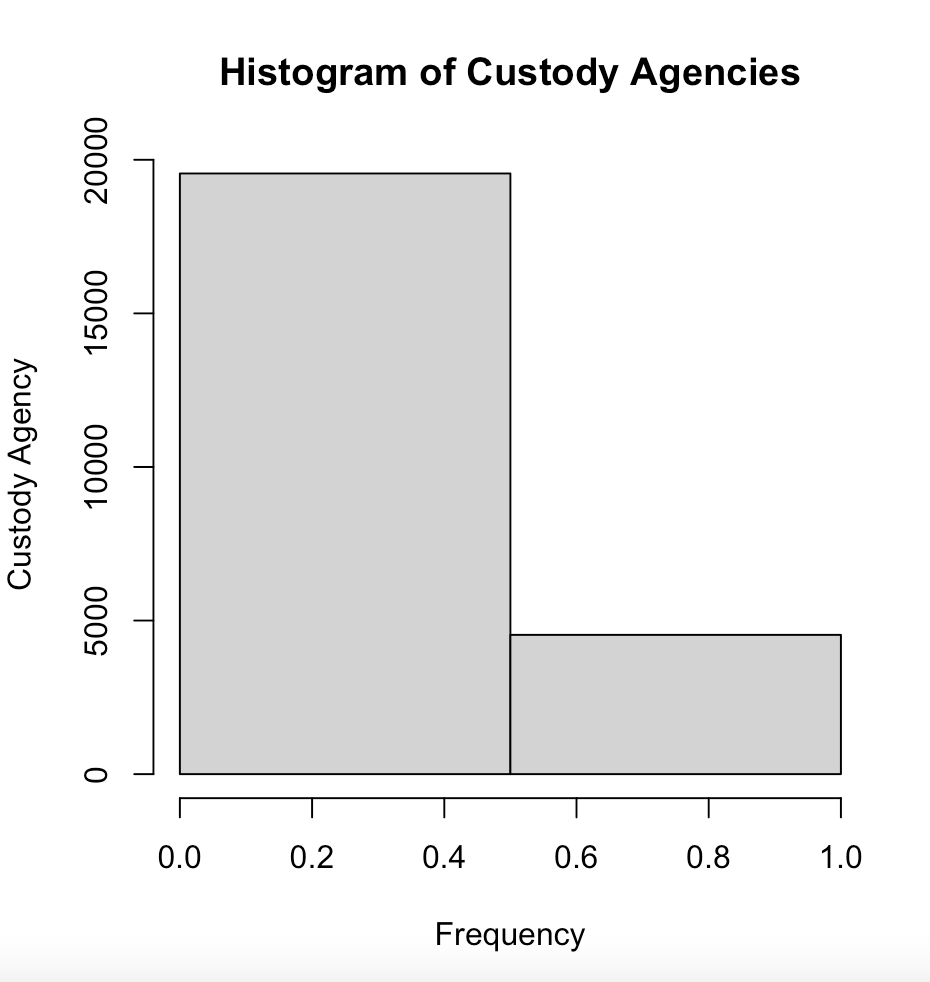

Linear Regression
For the analysis of this data set, we chose to do a linear regression as our model. We transformed the ‘custody_agency’ variable to be binary in which 1 = PDP and 0 = State, and we performed a transformation of the ‘race_ethnicity’ variable to be binary in which 0 = White and 1 = Black, Asian, Hispanic, and Other. We regressed the custody agency (binary) on race/ethnicity (binary) to look at the relationship between these variables. In the sections below we will address the assumptions to perform a linear regression, look at the results of the regression, and discuss the results and conclusions of the regression analysis.
Assumptions:
Linearity
Looking at the below residuals vs. fitted plot, we can see that the scatterplot smoother, showing the average value of the residuals at each value of fitted value, is pretty much flat across the plot. However, there are a group of outlying data points at the top right of the graph. The flatness of the red line indicates that there is no discernable non-linear pattern to the data. While the group of outlier data points is concerning, we will cautiously decide to proceed as though the linearity assumption is satisfied.
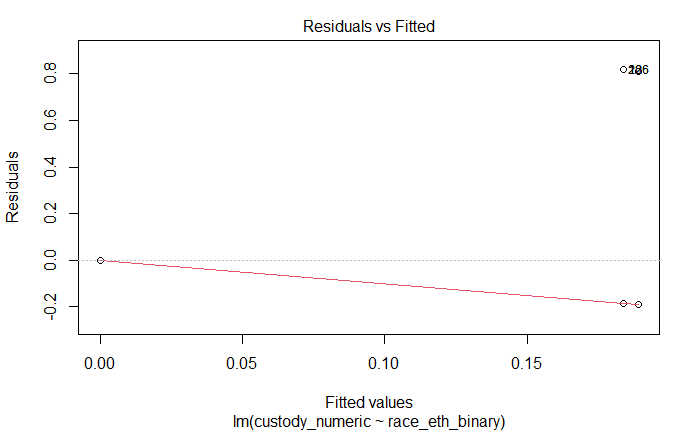
Independence
While the independence assumption cannot be proved as true, we can see from the Residuals vs. Fitted plot that there does not seem to be any discernible pattern of the data, suggesting that the variables are independent of each other. We must note the outlying points in the top right corner of the plot, but it is unclear at this point in our analysis how influential they may be. Therefore, we will also cautiously consider the independence assumption satisfied.Homoscedasticity
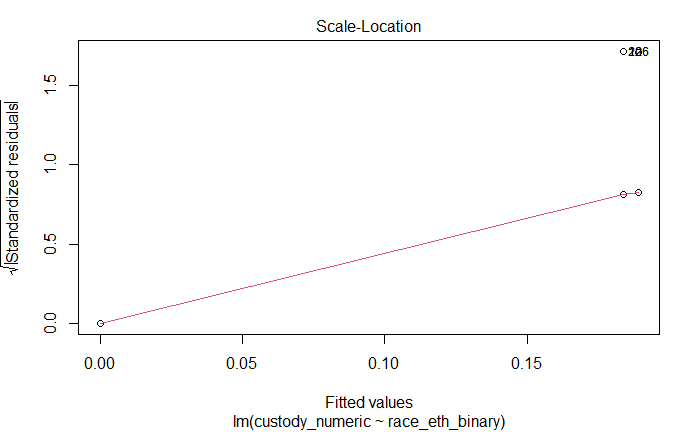
In the Scale-Location plot shown below, there is a clear trend to the red line on this plot, and there is a significant group of data points that do not fit the trend at the top right corner. This plot indicates that the residuals have non-constant variance. Therefore, the homoscedasticity assumption, that all the errors have the same variance, is not satisfied by this data.
Normality
As seen in the below normal Q-Qplot, the data really do not follow the trend of the line. Not only are they grouped in certain areas, but they also extend far past the line, to both the left and right, in each different grouping of data points. This demonstrates to us that the data is not normally distributed and does not satisfy the normality assumption.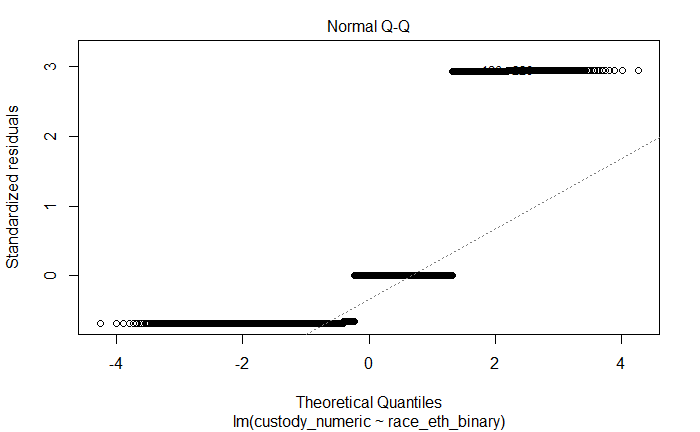
Regression Results and Causal Analysis:
For the regression of the custody numeric onto race, the results are as follows; the estimated coefficient is .0052, the standard error is .0069, and the p-value of the slope is .4537. Using 0.05 as our confidence interval, the p-value of .4537 shows us that the relationship between race and number of releases is not statistically significant. This p-value essentially tells us that if the null hypothesis (no relationship between the two variables) were true, the chances of observing a statistic such as this data set would be 45.37%, which is a pretty high chance. Given the results of this linear regression, it seems that there is no statistically significant relationship between the number of releases and the race of the inmates being released from Philadelphia prisons.
Although this is a very interesting topic to examine, it is not currently, and would not be able to be turned into, a casual estimate. Any relationship between an inmate’s release and their race would be solely correlational. While it’s possible for race to play a factor, even if subconsciously, in the prison system’s decision to release certain inmates, someone’s race itself is not causing their release or lack of release from prison. The purpose of this data analysis was to determine whether there was a relationship between the inmates released from prison in Philadelphia and their race, but there was no causal question to be addressed in this research. There is no way to make this research into a causal analysis, and the question at hand is merely correlative.
Causal DAG: 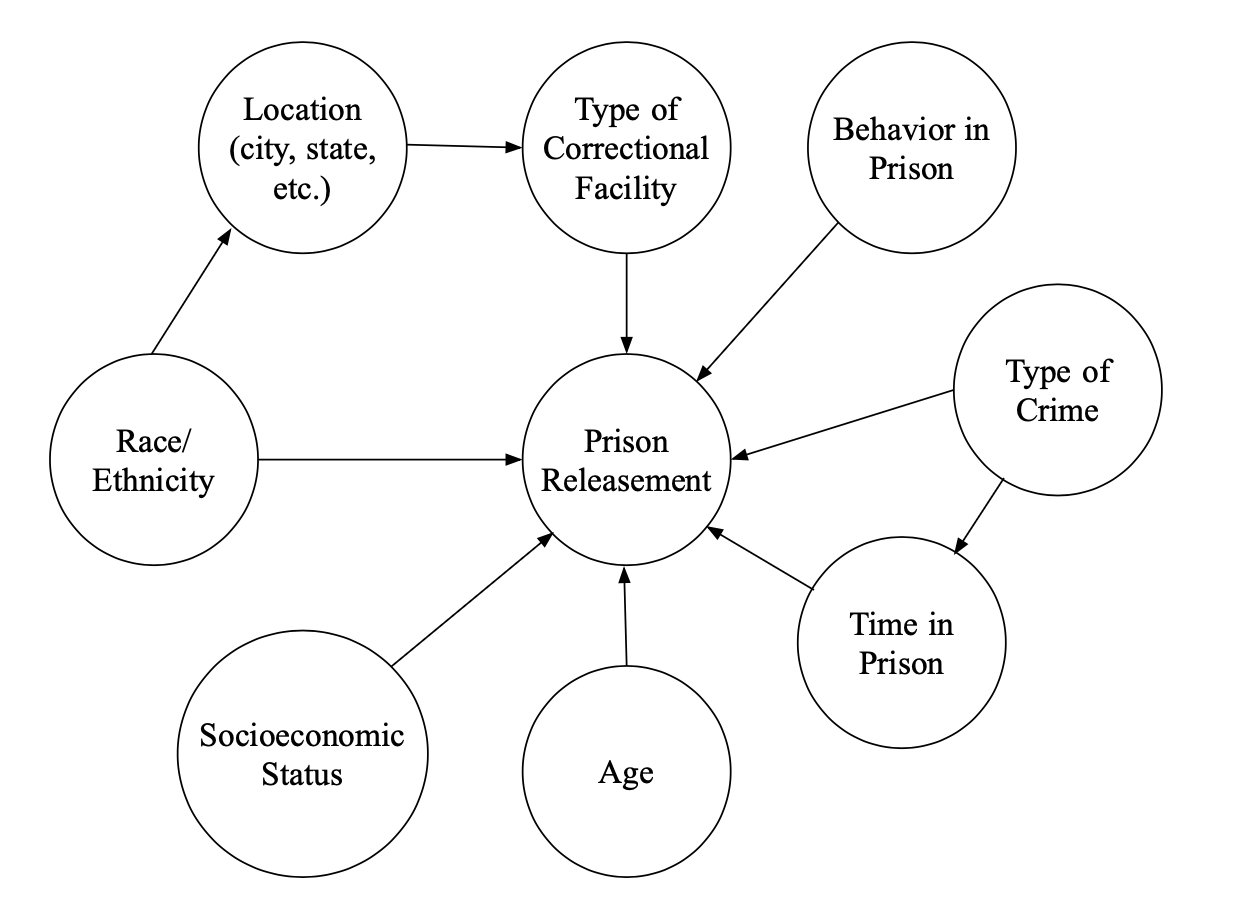
Discussion and Ideas for Future Work
Based on the linear regression analysis which regressed race onto Custody Agency data, there does not appear to be a statistically significant relationship between race and those released back into Philadelphia from city vs. state prisons/jails. However, there are a few factors that make us unsure of the reliability of this conclusion. Firstly, this data set did not meet all of the assumptions for performing a linear regression analysis. The Normality, Homoscedasticity, and Independence assumptions were not met, and the Linearity assumption was not solidly met. This is likely due to the fact that both variables were coded as binary, and a logistic regression would probably have been a better fit for this dataset and question. Secondly, even if the assumptions had been met to perform a linear regression for this data, any results found may not tell the whole story. Given that the demographics of Philadelphia prisons include higher proportions of people of color (11.8% White vs. 88.2% POC in 2015),[2] if an accurately completed regression had indicated that there was a positive association between being released from the State or PDP and being a person of color, this may just come down to there being more people of color in prisons to be released. Given these demographics, the result that would be interesting would be a positive association between being released and being white, or even no association at all, which would indicate potential discrimination in the release process. If one were to complete future research using this data set and transforming the data to perform linear regression, these are all factors that would have to be taken into consideration.
Despite not finding a causal relationship in our analysis, identifying bias and other problems in the prison system, especially regarding releases, is still worthwhile. Future research could include an examination of early releases versus releases of prisoners at the end of their sentence. Such an analysis could also include studying the behavior of inmates during their incarceration and how they are treated by prison staff and fellow inmates, factors which all work together to affect the possibility of early release. Additionally, since eligibility for parole is determined by human decision making, it is a process during which there can unfortunately be racial bias. A study of this issue could analyze racial disparities between inmates who are granted parole and those who have applied but are denied parole. This future research would also have to take the higher proportions of POC inmates into account when completing the statistical analysis. Another associated topic is sentencing. Research of bias in this department could address sentencing length disparities between people who committed the same type of crime but are of different races.
[1] People released to Philadelphia from prison & jail. OpenDataPhilly. (2018, March 8). Retrieved November 21, 2021, from https://www.opendataphilly.org/dataset/prison-releases.
[2] “Philadelphia Jail Population Report | July 2015 – April 2019.” Research and Development First Judicial District of Pennsylvania. Phila Gov. Accessed December 3, 2021. https://www.phila.gov/media/20190513144034/April-2019-Full-Jail-Report.pdf.